
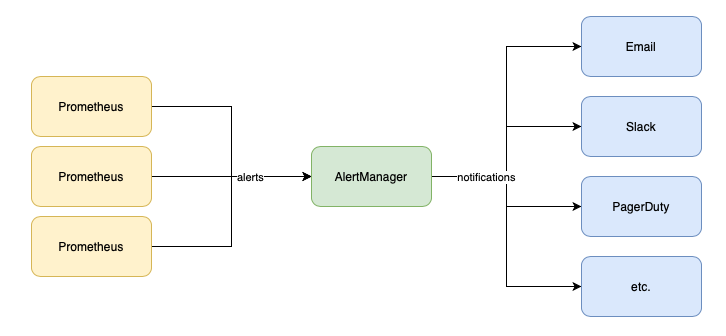
This post is the last one from the series “Prometheus for Managers”. In the second article from this series, the one about Prometheus Architecture, I touched on what Alertmanager does. So to recap, Prometheus allows for setting up alerts based on defined thresholds or conditions and AlertManager handles these alerts and sends them as notifications to multiple channels like email, slack, PagerDuty, etc.
The table of contents for this article:
- 1️⃣ Recording Rules
- 2️⃣ Alerting Rules
- 3️⃣ AlertManager Config
- 📚 Resources

Alerting involves two parts. Initially, it is about setting up alerting rules within Prometheus, outlining the criteria for triggering alerts. In the second part, the Alertmanager transforms active alerts into various notifications, including emails, pages, and chat messages.
The mechanism behind the scenes is that Prometheus allows you to define conditions in the form of PromQL expressions that are continuously evaluated, and any resulting time series become alerts.
Prometheus supports two types of rules which may be configured and then evaluated at regular intervals: recording rules and alerting rules.
1️⃣ Recording Rules
Recording rules allow you to precompute frequently needed or computationally expensive expressions and save their result as a new set of time series. Querying the precomputed result will then often be much faster than executing the original expression every time it is needed. This is especially useful for dashboards, which need to query the same expression repeatedly every time they refresh.
Recording rules go in separate files from your prometheus.yml, which are known as rule files. Each time this is changed, you must either restart Prometheus or reload its configuration to apply the latest changes.
To detect bad configuration files or rules in advance, you can use the promtool check config command to check your prometheus.yml. This will also check all the rule files referenced by the prometheus.yml.
prometheus.yml scraping two targets and loading a rule file
global:
  scrape_interval: 10s
  evaluation_interval: 10s
rule_files:
 - rules.yml
scrape_configs:
 - job_name: prometheus
   static_configs:
    - targets:
      - localhost:9090
 - job_name: node
   static_configs:
    - targets:
      - localhost:9100
The files with rules could contain zero or more groups of rules.
rules.yml file
groups:
 - name: example
   rules:
    - record: job:process_cpu_seconds:rate5m
      expr: sum without(instance)(rate(process_cpu_seconds_total[5m]))
    - record: job:process_open_fds:max
      expr: max without(instance)(process_open_fds)
In the sample from above, the group has a name. This must be unique within a rule file and is used in the Prometheus UI and metrics. expr is the PromQL expression to be evaluated and output into the metric name specified by record.
Each rule in a group is evaluated in turn, and the output of your first rule is ingested into the time series database before your second rule is run. While rules within a group are executed sequentially, different groups will be run at different times just as different targets are scraped at different times. This is to spread out the load on your Prometheus.
2️⃣ Alerting Rules
Alerting rules allow you to define alert conditions based on Prometheus expression language expressions and to send notifications about firing alerts to an external service. Whenever the alert expression results in one or more vector elements at a given point in time, the alert counts as active for these elements’ label sets.
Alerting rules are configured in Prometheus in the same way as recording rules. You can place alerting rules in the same rule groups as recording rules and can mix and match as you see fit.
groups:
 - name: node_rules
   rules:
    - record: job:up:avg
      expr: avg without(instance)(up{job="node"})
    - alert: ManyInstancesDown
      expr: job:up:avg{job="node"} < 0.5
In the above file, it defines an alert with the name ManyInstancesDown that will fire if more than half of your Node Exporters are down. You can tell that it is an alerting rule because it has an alert field rather than a record field.
For recording rules, you should avoid filtering in your expressions, as time series appearing and disappearing are challenging to deal with. For alerting rules, filtering is essential. If evaluating your alert expression results in an empty instant vector, then no alerts will fire, but if there are any samples returned, each of them will become an alert.
for
You don’t want to be woken up in the middle of the night for every artifact or oddity in your systems; you want to save your energy for real problems that affect users. Accordingly, firing alerts based on the result of a single rule evaluation is rarely a good idea. This is where the for field of alerting rules comes in.
groups:
- name: node_rules
  rules:
  - record: job:up:avg
    expr: avg without(instance)(up{job="node"})
  - alert: ManyInstancesDown
    expr: avg without(instance)(up{job="node"}) < 0.5
    for: 5m
The for field says that a given alert must be returned for at least this long before it starts firing. Until the for condition is met, an alert is considered to be pending. An alert in the pending state but that has not yet been fired is not sent to the Alertmanager.
Because for requires that your alerting rule return the same time series for some time, your for state can be reset if a single rule evaluation does not contain a given time series. To protect yourself against this behavior you will want to use use avg_over_time, last_over_time, or max_over_time that will offer you aggregation over time.
- alert: FDsNearLimit
  expr:
    (
        max_over_time(process_open_fds[5m])
      >
        max_over_time(process_max_fds[5m]) * 0.9
    )
  for: 5m
Alert Labels & Annotations
Just like with recording rules, you can specify labels an alerting rule. Using labels with recording rules is quite rare, but it is standard practice with alerting rules. They help you in organizing and categorizing alerts, making them actionable and informative.
The annotations field allows you to provide additional information about an alert, such as a brief description of what is going wrong. In the below sample $value is the value of your alert.
groups:
 - name: node_rules
   rules:
    - alert: ManyInstancesDown
      for: 5m
      expr: avg without(instance)(up{job="node"}) * 100 < 50
      labels:
        severity: page
      annotations:
        summary: 'Only {{printf "%.2f" $value}}% of instances are up.'
External Labels
External labels are labels applied as defaults when your Prometheus talks to other systems, such as the Alertmanager, federation, remote read, and remote write, but not the HTTP query APIs. External labels are the identity of Prometheus, and every single Prometheus in your organization should have unique external labels. external_labels is part of the global section of prometheus.yml:
global:
  scrape_interval: 10s
  evaluation_interval: 10s
  external_labels:
    region: eu-west-1
    env: prod
    team: frontend
alerting:
  alertmanagers:
   - static_configs:
      - targets: ['localhost:9093']
3️⃣ AlertManager Config
Alertmanager is composed of several components that work together to provide a flexible and powerful alert management system.
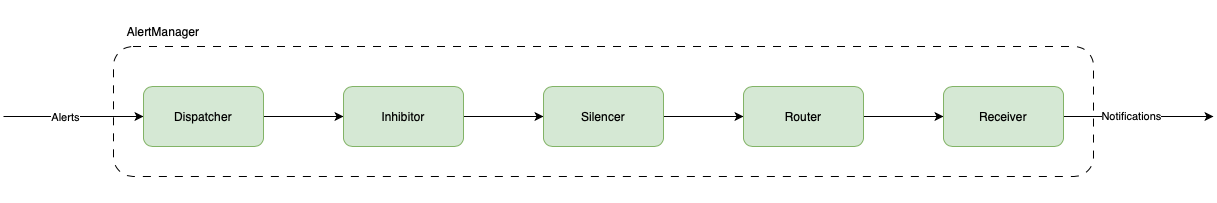
Here is a brief overview of some of the key Alertmanager components:
- Dispatcher is responsible for processing incoming alerts, deduplicating them, grouping them by their labels, and sending them to the router.
- Inhibitor allows users to suppress alerts based on the presence of other alerts. This can be useful in situations where a higher-level alert should suppress lower-level alerts to avoid unnecessary noise. For example, if a server is down, there is no need to receive alerts for all of the services running on that server.
- Silencer allows users to temporarily suppress alerts for a given time. This can be useful in situations where a known issue is being addressed or during maintenance windows when alerts are not needed. The Silencer supports both manual and automatic silencing based on a set of predefined rules.
- Router is responsible for determining which receiver(s) should receive a given alert. It uses a set of routing rules that are defined by the user to match alerts based on their labels and route them to the appropriate receiver(s). The Router supports powerful regular expression matching and can be configured to route alerts based on the severity or type of the alert.
- Receiver is a key component that defines how alerts are sent to various notification channels or systems. The Receiver is essentially a target for alerts, and it defines which notification channels should be used for a particular alert. The notifications sent to receivers are constructed via templates. The Alertmanager comes with default templates but they can also be customized. To avoid confusion it’s important to note that the Alertmanager templates differ from templating in Prometheus, however, Prometheus templating also includes the templating in alert rule labels/annotations.
For example, a minimal configuration that sends everything to an email address using a local SMTP server would look like:
global:
  smtp_smarthost: 'localhost:25'
  smtp_from: 'yourprometheus@example.org'

route:
  receiver: example-email

receivers:
 - name: example-email
   email_configs:
    - to: 'youraddress@example.org'
‘yourprometheus@example.org’ = The email address that will be used as the From field.
‘youraddress@example.org’ = The email address the emails will be sent to.
To validate the alertmanager.yaml file you could use amtool: ./amtool check-config alertmanager.yml
Routing Tree
The route field specifies the top-level, fallback, or default route. Routes form a tree, so you can and usually will have multiple routes below that. For example, you could have:
route:
  receiver: fallback-pager
  routes:
   - matchers:
       - severity = page
     receiver: team-pager
   - matchers:
       - severity = ticket
     receiver: team-ticket
When an alert arrives, it starts at the default route and tries to match against its first child route, which is defined in the (possibly empty) routes field. If your alert has a label that is exactly severity="page", it matches this route and matching halts, as this route has no children to consider.
If your alert does not have a severity="page" label, then the next child route of the default route is checked; in this case, for a severity="ticket" label. If this matches your alert, then matching will also halt. Otherwise, since all the child routes have failed to match, matching goes back up the tree and matches the default route. This is known as a post-order tree transversal, which is to say that children are checked before their parent, and the first match wins.
Next to the = operator in matchers, there are other operators like !=, =~, and !~ . =~ requires that the given label match the given regular expression, and !~requires that it does not match the given regular expression. As with almost all other places, regular expressions are fully anchored.
I hope you found this series helpful in getting a high-level understanding of what Prometheus is, its architecture, how you could use PromQL to query the data, and how you could configure alerts to notify when something not ok is happening with your system. Thank you! 🙏
📚 Resources
Sources used in this article:
- Official docs about AlertManager
- “Prometheus: Up & Running, 2nd Edition” by Julien Pivotto and Brian Brazil.
- How to build an alerting system with Prometheus and Alertmanager
If you want to learn more:
- A list with awesome Prometheus alerts
- Alerting in the Prometheus Ecosystem: The Past, Present and Future – Josue (Josh) Abreu
- Prometheus Intro and Deep Dive – Julius Volz, Björn Rabenstein, Matthias Rampke
- The Future is Bright, the Future is Prometheus Remote Write – Tom Wilkie, Grafana Labs
- How to Be 10x SRE? A Deep Dive to Prometheus Operator – Jayapriya Pai & Haoyu Sun, Red Hat
