This article serves as a continuation of our series dedicated to Prometheus, designed specifically for managers aiming to harness the power of Prometheus within their teams. While not delving into intricate technical details, it provides essential insights and architectural concepts necessary for managers to make informed decisions and effectively leverage Prometheus in their organizations.
In this article we will explore the following areas:
🔖 Prometheus Terminology
🧐 Prometheus Architecture Deep Dive
So, let’s begin!

🔖 Prometheus Terminology
Targets: Refers to the entities (endpoints, servers, applications) from which Prometheus collects metrics. These targets are configured in Prometheus’ service discovery or static configuration.
Scraping: The process by which Prometheus collects metrics from the configured targets (servers, services, endpoints). It pulls metrics at regular intervals from these targets.
Instance: Refers to a specific endpoint, server, or individual service that is the target of monitoring. An instance typically represents a single host or resource that Prometheus collects metrics from.
Job: A set/collection of targets that are monitored together as a group. It’s a way to organise and manage related instances or endpoints that perform the same function or have the same purpose within a system
Sample: An individual data point in a time series. It represents a specific value of a metric at a particular point in time. Each sample is associated with a timestamp and represents the value of a metric at that exact moment. A sample includes two components:
- Timestamp: The time when the metric value was recorded.
- Value: The numeric value of the metric at that timestamp.
http_request_total {method = “get”} → 32
🧐 Prometheus Architecture Deep Dive
Prometheus Architecture contains 4 main components:
- Prometheus Server
- Prometheus Targets
- Prometheus Alerting
- Data Visualisation

➡️ Prometheus Server
The Prometheus server is the core component of the Prometheus monitoring system. It is responsible for collecting, processing, storing, and serving time-series data. The server continuously scrapes (pulls) metrics from configured targets, stores these metrics as time-series data, and makes them available for querying and analysis.
Key features and functions of the Prometheus server include:
Metrics Collection & Retrieval
- The server collects metrics from various endpoints or targets (such as applications, services, or infrastructure components) using HTTP protocols or exporters that expose metrics in Prometheus format.
- Prometheus could scrape metrics from other Prometheus instance.
- There are components that could be not scraped, for example short-lived jobs. In this situation it uses a Pushgateway and the jobs will push the metrics to this gateway (the intermediate entity) so they can be later scraped using the pull mechanism. To learn more about the use cases when you should use Pushgateway, check the official guide.
Storage
- Metrics data is stored in a time-series database. It organizes the data by metric names and labels, making it easy to retrieve and query specific time series efficiently.
- Prometheus uses a local on-disk storage by default, organising and indexing metrics for efficient querying.
- Time-series data is retained for a configurable duration (set by the retention period). Older data that exceeds the retention period can be discarded, ensuring storage resources are effectively utilized.
- Internally, Prometheus stores data in chunks, which are then compacted or compressed to save disk space and improve query performance. This chunk-based storage format optimizes storage efficiency. Ingested samples are grouped into blocks of two hours.
- Prometheus builds and maintains indexes that allow for quick and efficient lookup of time-series data based on metric names and labels, facilitating fast query performance.
- Prometheus uses a Write-Ahead Log for durability, ensuring that incoming samples are first written to a log before being committed to the database. These files contain raw data that has not yet been compacted. This mechanism guarantees data consistency and resilience in case of failures.
- In terms of compaction: “The initial two-hour blocks are eventually compacted into longer blocks in the background. Compaction will create larger blocks containing data spanning up to 10% of the retention time, or 31 days, whichever is smaller.”
Service Discovery
- Service discovery is a fundamental feature in Prometheus that automates the process of identifying and monitoring targets dynamically, reducing the manual effort required to manage configurations when new instances or services are added or removed.
- Prometheus provides a generic HTTP Service Discovery, that enables it to discover targets over an HTTP endpoint.
- Below is a limited list of the common methods used for service discovery in Prometheus (the entire list could be found here):
- File-Based Service Discovery: Prometheus can discover targets by reading from configuration files where targets and labels are defined. Changes to these files can be dynamically detected by Prometheus without needing a restart.
- Static Configurations: Static configurations involve explicitly defining the targets in the Prometheus configuration file. This method is useful for specifying fixed or known targets that are relatively stable. Not recommended if infrastructure changes happen often.
- Consul Service Discovery: Prometheus integrates with Consul, a service discovery tool, to automatically discover and monitor services registered in Consul. It can scrape metrics from services registered in Consul.
- DNS-Based Service Discovery: Prometheus can perform service discovery using DNS entries. It can resolve DNS names to discover targets dynamically.
- Kubernetes Service Discovery: For Kubernetes environments, Prometheus can discover and monitor pods, services, and endpoints by querying the Kubernetes API server. It uses Kubernetes labels and annotations to filter and select targets.
- EC2 Service Discovery: In AWS environments, Prometheus can dynamically discover and monitor EC2 instances using service discovery mechanisms tailored for AWS infrastructure.
➡️ Prometheus Targets
Here are some key aspects related to Prometheus targets:
- Types of Targets: Targets can be diverse and include various types of systems, such as applications, servers, containers, databases, or any service exposing metrics in a format that Prometheus can understand.
- Scraping Metrics: Prometheus collects metrics from targets through HTTP or HTTPS protocols, accessing a specific endpoint on the target that provides metrics in Prometheus exposition format.
- Configuration: Targets are defined in the Prometheus configuration file (usually
prometheus.yml). Configuration includes the target’s URL, scraping interval, and additional metadata or labels. - Static vs. Dynamic Targets: Targets can be statically defined in the configuration file or dynamically discovered using service discovery mechanisms. Static targets need manual configuration, while dynamic targets are automatically identified based on defined rules or criteria.
- Labels and Metadata: Labels associated with targets help in categorizing, filtering, and identifying the targets. Labels can be used to group and differentiate targets, providing additional context or information.
- Monitoring Configuration: Each target’s configuration in Prometheus includes the URL or endpoint, scraping intervals, and additional settings necessary for monitoring.
- Health Checking: Prometheus includes functionality to perform health checks on targets to ensure they are up and running. It can generate alerts if a target is unreachable or not providing metrics.
Sample of a configuration file:
global:
  scrape_interval: 15s
  evaluation_interval: 15s

scrape_configs:
  - job_name: 'static-targets'
    static_configs:
      - targets: ['app1:8080', 'app2:9090']
        labels:
          group: 'myapps'
          environment: 'production'

  - job_name: 'kubernetes-pods'
    kubernetes_sd_configs:
      - role: pod
    relabel_configs:
      - source_labels: [__meta_kubernetes_pod_label_app]
        action: keep
        regex: myapp.*

  - job_name: 'ec2-instances'
    ec2_sd_configs:
      - region: us-west-2
        access_key: 'YOUR_ACCESS_KEY'
        secret_key: 'YOUR_SECRET_KEY'
    relabel_configs:
      - source_labels: [__meta_ec2_tag_Name]
        target_label: instance
Explanation of the configuration:
global: Contains global configurations for Prometheus, setting the scrape interval and evaluation interval for all jobs.scrape_configs: Refers to the list of scrape configurations.static-targets: Defines a job namedstatic-targetswith statically configured targets.static_configs: Indicates static target configurations. Here, ‘app1:8080’ and ‘app2:9090’ are defined as static targets.labels: Adds labels to these targets for grouping and categorization.
kubernetes-pods: Configures a job namedkubernetes-podsfor dynamically discovering Kubernetes pods.kubernetes_sd_configs: Specifies Kubernetes service discovery as the source of targets.relabel_configs: Modifies or filters labels. Here, it filters pods labeled as ‘myapp.*’.
ec2-instances: Sets up a job namedec2-instancesfor discovering EC2 instances in a specific region.ec2_sd_configs: Configures EC2 service discovery in the ‘us-west-2’ region with access and secret keys.relabel_configs: Modifies labels by mapping the EC2 tag ‘Name’ to a new label ‘instance’.
➡️ Prometheus Alerting
Prometheus allows for setting up alerts based on defined thresholds or conditions.
Alerting involves two parts. Initially, it is about setting up alerting rules within Prometheus, outlining the criteria for triggering alerts. The second part, the Alertmanager transforms active alerts into various notifications, including emails, pages, and chat messages.
Key aspects related to Alertmanager:
- Receiving alerts: The Alertmanager receives alerts from Prometheus based on predefined alerting rules and groupings.
- Grouping and deduplication: It groups similar alerts and deduplicates them to avoid overwhelming the recipients with redundant notifications.
- Routing and inhibition: It routes alerts to appropriate receivers, such as email, Slack, or other integrations, based on defined routes. It also inhibits or suppresses specific alerts under certain conditions.
- Silencing and filtering: The Alertmanager provides the ability to silence specific alerts for a defined period or filter out certain alerts based on defined criteria.
- Integration with notification channels: It integrates with various communication channels and platforms for sending notifications, including email, PagerDuty, Slack, and others.
- Web UI and API: The Alertmanager has a web-based user interface and an API for managing silences, configurations, and viewing alert details.
➡️ Data Visualisation
Prometheus offers several HTTP APIs facilitating both raw data requests and PromQL query evaluations, enabling graph and dashboard creation. By default, Prometheus includes an expression browser utilizing these APIs, ideal for on-the-fly queries and data exploration, though it isn’t a comprehensive dashboard system.
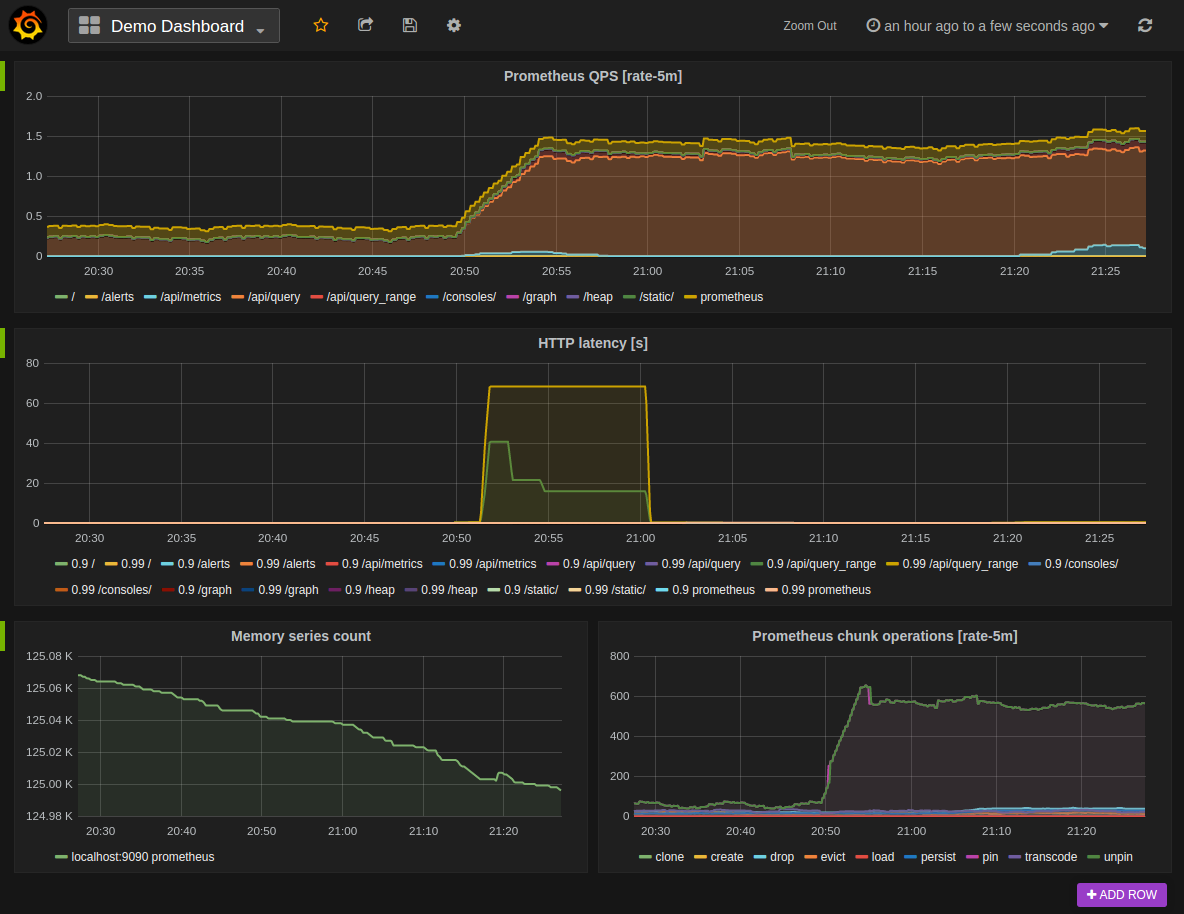
For comprehensive dashboards, it’s recommended to utilize Grafana. Grafana boasts extensive functionalities and officially supports Prometheus as a data source.
Based on the official docs, “with Grafana you can create, explore, and share all of your data through beautiful, flexible dashboards”.