
This article marks the beginning of a series dedicated to Prometheus. These articles are specifically tailored for managers who aim to leverage Prometheus within their teams. While the content will not delve into excessive technical details, it will encompass sufficient information and concepts to enable managers to effectively utilize Prometheus.
Specifically, I will cover:
- 🧐 What is Prometheus
- 🖥️ Operational monitoring
- 📊 Metrics vs Events
- 🧩 Strategies for handling large volumes of data
So let’s get started!

🧐 What is Prometheus
Prometheus is an open-source, metrics-driven monitoring system that enables us to analyse the performance of our applications and infrastructure. With a specific focus on the metrics space, Prometheus provides valuable insights into how our systems are operating.
Even before the existence of Kubernetes and Docker, the Soundcloud team acknowledged the necessity for a thorough and fundamental redesign of their monitoring system. This ambitious task was far from simple, but it held the potential to revolutionise the industry’s perception of monitoring. To learn more about Prometheus’s history, you can watch this insightful documentary 🤓.
🖥️ Operational monitoring
When we are referring to the operational monitoring we address 4 different areas:
🔵 Alerting – The primary objective of monitoring is to promptly identify and address any issues or anomalies. The critical aspect is being aware of when things are deviating from the expected state. In such situations, the monitoring system should be capable of alerting a human operator to investigate and resolve the situation.
🔵 Debugging – Once a human operator has been alerted, their responsibility is to thoroughly investigate the situation in order to identify the underlying cause of the issue. This investigative process is crucial for resolving the problem effectively. The operator must analyse the available data, diagnose the root cause, and implement the necessary actions to rectify the issue and restore normal operations.
🔵 Trending – Alerting and debugging are typically performed within minutes to hours to address immediate concerns. However, it is equally important to track system usage and changes over time. Trending data informs design decisions and processes like capacity planning, enhancing system stability and efficiency.
🔵 Plumbing – Monitoring systems can serve as flexible data processing pipelines. Sometimes, it’s more convenient to repurpose parts of the monitoring system for other needs instead of creating new solutions. While this extends beyond traditional monitoring, it’s a common and practical approach that we embrace.
📈 Metrics vs Events
Observability is a critical concept in system monitoring and management. It involves collecting and analyzing data to gain insights into the behavior and performance of a system. Two fundamental types of data used in observability are metrics and events, each serving distinct purposes.
Metrics
Metrics are quantitative measurements that provide a continuous view of a system’s performance and behavior. They are typically collected at regular intervals and represent a snapshot of a system’s state. Here are some key characteristics of metrics:
- Numerical Values: Metrics are numerical and quantitative. They represent things like response times, error rates, CPU usage, and memory consumption.
- Aggregated Data: Metrics are often aggregated over a specific time period (e.g., every second, minute, or hour). This aggregation helps in summarizing trends and patterns.
- Time-Series Data: Metrics are usually organized as time-series data, allowing for historical analysis and visualization through graphs and charts.
- Example Metrics:
- CPU utilization percentage over time.
- Response time of a web server for each HTTP request.
- Memory usage in megabytes over a day.
Events
Events, on the other hand, are discrete, timestamped records that capture specific occurrences or incidents within a system. They provide a more detailed and contextual understanding of what’s happening. Here are some key characteristics of events:
- Structured Data: Events contain structured data that describe a particular incident or state change. This structured data may include information like timestamps, error messages, and event types.
- Real-Time Information: Events are generated in real-time as incidents occur. They provide immediate information about what’s happening within a system.
- Examples of Events:
- Error messages with detailed stack traces.
- User login events, capturing the username, timestamp, and source IP address.
- Security alerts triggered by suspicious activities.
When to Use Metrics vs. Events
The choice between using metrics or events depends on the specific monitoring and observability needs of your system:
- Use Metrics When:
- You need to monitor and visualize trends over time.
- You want to track the overall performance of a system.
- Aggregated data is sufficient for understanding system behavior.
- Use Events When:
- You need detailed context about specific incidents or changes.
- Real-time notification and alerting for critical events are required.
- You want to capture structured information about discrete occurrences.
Metric Types

In Prometheus, metrics are categorized into four primary types: counters, gauges, histograms, and summaries. Each type serves a distinct purpose in capturing and analyzing system activity.
Counters: Tracking Cumulative Values
Counters are cumulative metrics that represent the total number of occurrences over time. Do not use a counter to expose a value that can decrease (use a Gauge instead).
Example Counter Metrics:
node_cpu_seconds_total: Tracks the total amount of CPU time consumed by a nodehttp_requests_total: Tracks the total number of HTTP requests received by an endpoint
Gauges: Reflecting Instantaneous Values
Gauges are instantaneous metrics that represent the current value of a metric at a specific point in time. They are typically used to track metrics that can fluctuate, such as memory usage, network traffic, and disk usage.
Example Gauge Metrics:
node_memory_free: Tracks the amount of free memory on a nodehttp_request_duration_seconds: Tracks the average request duration for an endpoint
Histograms: Analyzing Distributions
Histograms are metrics that provide a more detailed view of the distribution of metric values by dividing the range of values into buckets. They are typically used to monitor metrics that exhibit a range of values, such as response times, request sizes, and error rates.
Example Histogram Metrics:
http_request_duration_seconds_histogram: Tracks the distribution of HTTP request durationsnode_disk_io_time_seconds_histogram: Tracks the distribution of disk I/O time across different I/O operationsjvm_gc_pause_time_seconds_histogram: Tracks the distribution of Java garbage collection pause times
Summaries: Providing Quantitative Insights
Summaries are similar to histograms, but they provide more granular insights by calculating configurable quantiles over a sliding time window. Quantiles are specific percentiles of the distribution, such as the 50th percentile, which represents the median value.
Example Summary Metrics:
http_request_duration_seconds_summary: Tracks the 50th, 90th, and 99th percentiles of HTTP request durationsnode_disk_io_time_seconds_summary: Tracks the 50th, 90th, and 99th percentiles of disk I/O time across different I/O operationsjvm_gc_pause_time_seconds_summary: Tracks the 50th, 90th, and 99th percentiles of Java garbage collection pause times
Summary: The Role of Each Metric Type
Counters capture the overall accumulation of events, Gauges reflect the current state of a metric, Histograms provide a detailed view of the distribution, and Summaries offer quantitative insights into the distribution. By combining these four types of metrics, Prometheus offers a comprehensive view of system health and performance.
For instance, by tracking both HTTP request counts (Counter) and request durations (Histogram, Summary), users can identify trends in request performance and pinpoint potential bottlenecks. Similarly, by tracking CPU usage (Counter), CPU throttling events (Gauge), and CPU distribution percentiles (Summary), users can identify instances of CPU overload and potential performance degradation.
🧩 Strategies for handling large volumes of data
To manage the vast amount of data and facilitate understanding, there are four approaches available: profiling, tracing, logging, and metrics. These methods help reduce the data volume while providing valuable insights for debugging and performance evaluation.
🟡 Profiling
Profiling acknowledges that it is not feasible to have complete context for every event at all times. Instead, it focuses on capturing partial context during specific time intervals.
An example of a profiling tool is Tcpdump, which enables recording of network traffic based on specified filters. While Tcpdump is an invaluable debugging tool, it cannot be continuously active due to limitations in disk space.
Profiling is commonly used for tactical debugging. For longer-term usage, data volume must be reduced or continuous profiling can be implemented for extended data collection.
🟡 Tracing
Tracing selectively captures a subset of events, such as a fraction of requests or specific functions of interest. It provides insights into program performance, identifying latency-contributing code paths. Distributed tracing extends this approach across processes, enabling debugging in distributed microservices architectures.
🟡 Logging
Logging captures a selective set of events, recording some context for each event. There is typically a limit of around a hundred fields per log entry to avoid excessive resource usage and address bandwidth and storage constraints.
Handling different types of logs in a uniform manner can result in the drawbacks of managing both the high data volume of debug logs and the reliability demands of transaction logs. Therefore, as your system grows, it is recommended to split the debug logs for separate handling and better management.
🟡 Metrics
Metrics focus on aggregating events over time, without extensive context. To maintain resource efficiency, it’s advisable to limit the number of tracked metrics, typically around 10,000 per process. This highlights the trade-off between logs and metrics, where logs provide detailed event information but have limited context fields, while metrics offer system-wide insights with fewer context fields. Prometheus, as a metrics-based monitoring system, prioritize tracking overall system health, behavior, and performance rather than individual events.
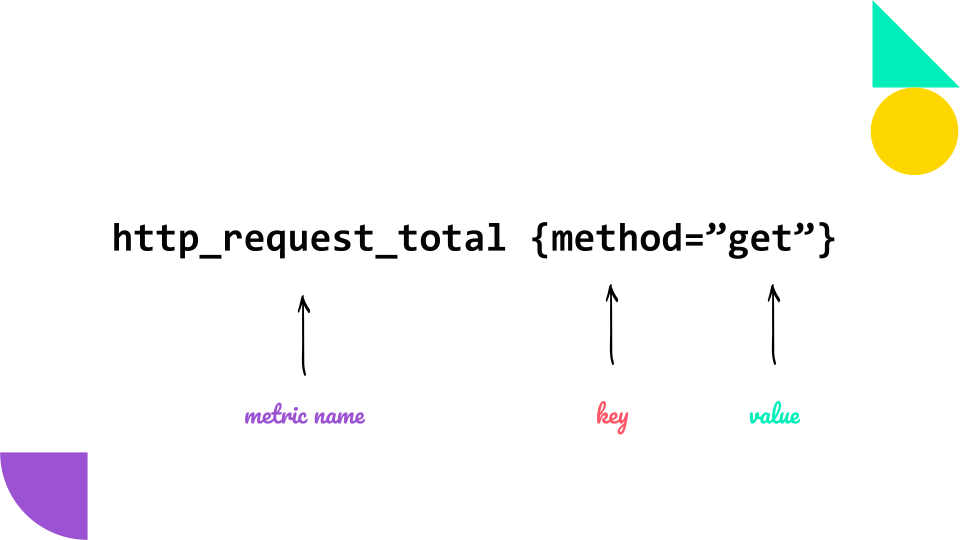
Prometheus uses a “multi-dimensional” data model with “time series data” identified by “metrics name” and “key/value pairs”. Prometheus also offer a very simple and flexible query language “PromQL” (Prometheus Query Language) which is read-only and allows aggregation across any of the labels stored in its time series.
📃 Summary
✅ Prometheus is a monitoring and alerting system for distributed systems and infrastructur
⛔ Prometheus is NOT a business intelligence reporting system.
The content of these articles draws inspiration from various sources, including the book “Prometheus: Up & Running, 2nd Edition” by Julien Pivotto and Brian Brazil. In the next post we will cover the Prometheus Architecture.

